Table of Contents
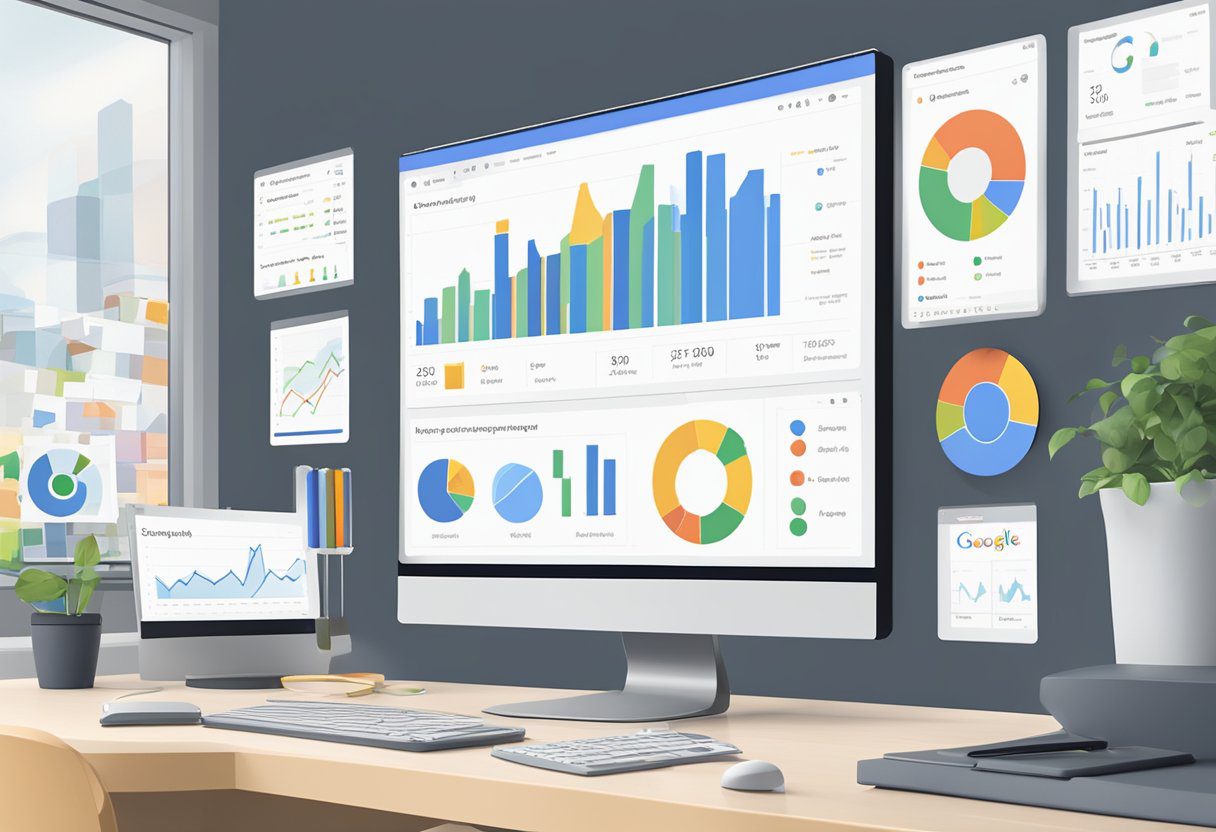
Google Data Studio is a free tool that transforms data into customisable informative reports and dashboards that are easy to read, easy to share, and fully customisable. Developed by Google, this tool allows its users to pull data from various sources like Google Analytics, Google Ads, and more, enabling profound insights through real-time collaboration and reporting. It stands out in the sea of data visualisation tools for its seamless integration with other Google products, making it a convenient option for those already in the Google ecosystem.

The ease of use is one of the primary features that makes Google Data Studio so appealing, especially for those new to data reporting. Users have the ability to create reports from scratch or utilise existing templates to jumpstart their analytics. With the option to connect to multiple data sources, users can create comprehensive reports without significant technical expertise. Moreover, since it is cloud-based, sharing insights with team members or stakeholders is as simple as sharing a link, facilitating collaborative efforts in a way that’s efficient and accessible.
Among its many features, the platform boasts real-time collaboration, similar to other Google Suite tools. This ensures that teams can work on reports simultaneously, making real-time decision-making more attainable. Whether it’s for an individual’s use or for a team, Google Data Studio provides a robust solution for data analysis and creating visually compelling reports that aid in making informed business decisions.
Getting Started with Google Data Studio
Google Data Studio transforms the way analysts and marketers visualise and report data. To unleash its full potential, familiarising oneself with the basics—from signing in to sharing—is pivotal.
Signing In and Navigating the Interface
To begin, users must sign in with their Google account. The user interface (UI) is intuitive, featuring a toolbar menu which is the gateway to various functionalities. The initial view presents a gallery of dashboards and reports.
Connecting to Data Sources
Data sources can range from Google Sheets and Google Analytics to SQL databases like MySQL. Connection is seamless through Data Studio’s connectors. These connectors facilitate real-time access to data for live data analysis.
Exploring Pre-Made and Custom Templates
The Template Gallery offers a selection of pre-made templates for rapid report creation. Users can also design custom reports, using templates as a starting point to meet specific analytics needs.
Understanding Data Studio Reports and Visualizations
In Data Studio, a report may consist of multiple pages, each with a variety of visualisations including charts, graphs, and tables. Accurate data visualisation can be achieved through a drag-and-drop interface.
Configuring and Customising Reports
Custom reports are configured by adding charts, scorecards, and other elements. Calculated fields and filters can refine data further, while customisation options like color scheme, border, and background color enhance aesthetics.
Designing for Different Devices
Reports in Data Studio are responsive and can be optimised for both desktop and mobile devices. Alignment and layout adjustments ensure interactive dashboards are accessible across all devices.
Effective Sharing and Collaboration
Collaboration is streamlined, with options to share reports via Google Docs and Google Drive. Stakeholders can share data and insights conveniently, ensuring secure collaborative environments.
Google Data Studio Features Overview
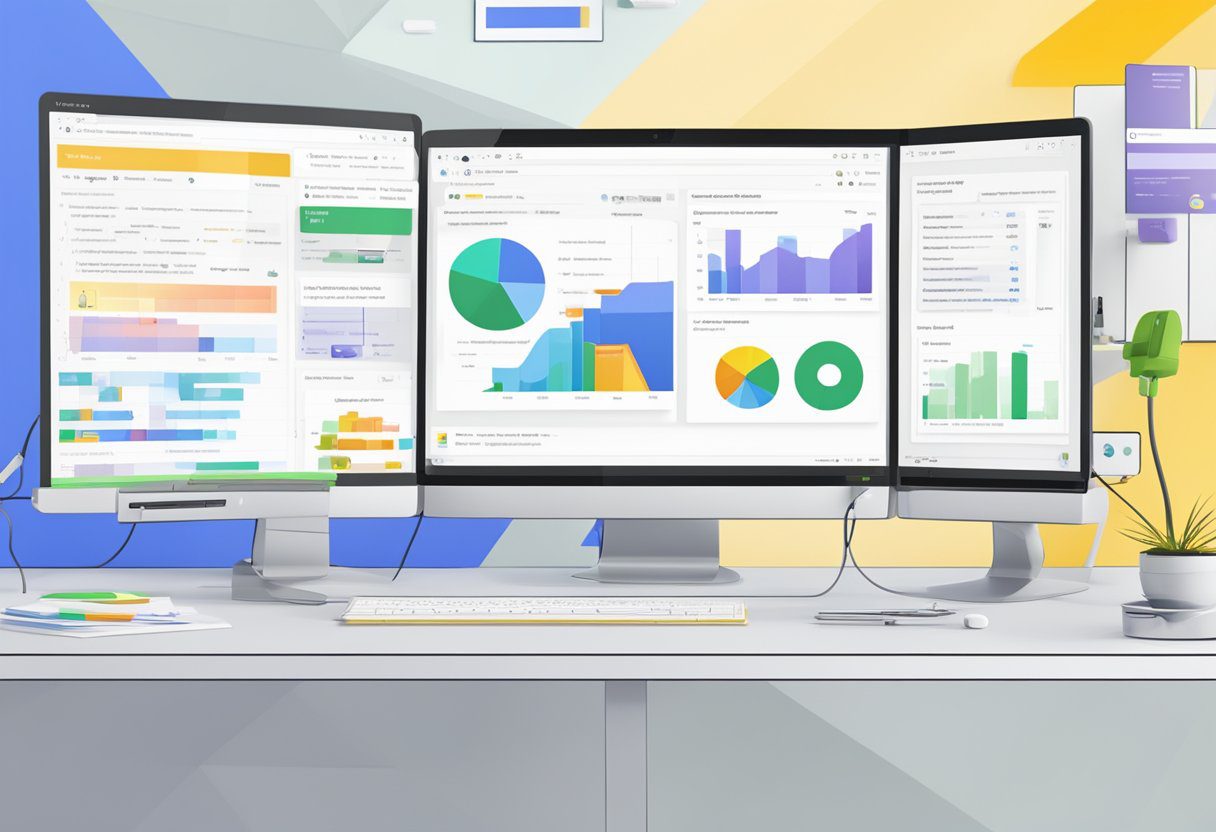
Data Studio’s features are powerful and diverse, offering everything from basic visualisation to advanced data analysis options. Its ability to visualise data in real-time and integrate analytics makes it a potent web analytics platform.
Leveraging Advanced Data Studio Features
For complex data manipulation, Data Studio includes advanced options such as data blending and interactive data visualisation, facilitating deeper insights through sophisticated graphic design elements.
Working with Community Visualisations and Connectors
The platform supports community visualisations and data connectors, allowing users to import custom visuals and connect to various data sources like Excel, Facebook, and Twitter.
Capitalising on Integration Capabilities
Integration with other Google services enriches the data context. This includes Google Sheets, real-time Google Analytics data, YouTube, and even geographical data through Google Maps.
Enhancing Presentations with Dynamic Features
Vivid presentations utilise live data, enabling dynamic line charts and maps. The integration of Google Maps in dashboards adds a geographical layer to the visual story.
Utilising External Data in Data Studio
*A versatile feature is the ability to pull data from multiple data sources, including spreadsheets and SQL databases. This integration provides a comprehensive view across different platforms.
Advanced Reporting for Expert Marketers
Expert marketers utilise Data Studio for creating intricate brand reports and data-driven reports, leveraging its full suite to transform metrics into strategic insights, crucial for informed decision-making.
Frequently Asked Questions
This section addresses common inquiries about Google Data Studio setup and features, providing concise guidance for users seeking enhanced data visualisation and reporting.
How do I initialise Google Data Studio for my data visualisation needs?
One may initialise Google Data Studio by navigating to the platform’s main dashboard and creating a new report. A user can then customise their data visualisation by connecting to various data sources.
Could you elucidate the uses of Google Data Studio in data analysis and reporting?
Google Data Studio serves as an indispensable tool for data analysis and reporting by allowing users to transform their data into informative, easy-to-read, interactive reports and dashboards that are shareable with team members or clients.
What distinct features does Looker Studio offer to its users?
Looker Studio, previously known as Google Data Studio, offers distinctive features such as real-time data collaboration, customisable visualisation options, and the integration of various data sets into a single report.
What are the primary advantages of utilising Google Data Studio for business intelligence tasks?
The primary advantages of using Google Data Studio include its cost-effective pricing structure, as it is provided at no charge, and its deep integration with other Google products, making it a highly accessible and functional business intelligence tool.
Can you detail the process for integrating Google Data Studio with other data sources?
Integrating Google Data Studio with other data sources typically involves selecting ‘Add Data’ within a report and choosing from the wide range of available connectors, which include marketing services and databases, to enhance one’s data analysis.
Which advanced capabilities in Looker Studio should I be aware of to enhance my dashboards?
Users should be aware of Looker Studio’s advanced capabilities like calculated fields for bespoke data metrics, custom data blending for comprehensive insights, and embedding reports on websites to boost the potential of their dashboards.